From Routine EMR Data to Actionable Surveillance: The EINSTEIN Story
July 28, 2026
Turning hospital data into an AI-powered early-warning system for infections in cancer patients. Based on a presentation by clinical pharmacist and researcher Anna Khanina at the BioGrid Symposium and Annual General Meeting on 28 April, 2026
Clinicians who care for patients with blood cancers know that surveillance of serious infections is important for patient care, however it can be difficult to undertake. In many hospitals, the work of monitoring infection trends is still done manually, and often this time-consuming process reduces the ability to identify infection outbreaks in a timely manner. That is the problem the EINSTEIN project set out to solve.
EINSTEIN — Enhancing INfection Surveillance to Transform Excellence In National cancer care — is a program run by the National Centre for Infections in Cancer (NCIC) at Peter MacCallum Cancer Centre. Its goal is simple: take data that hospitals already collect every day inside the electronic medical record (EMR), and turn it into something a clinician can act on: a dashboard, updated regularly, with the information they need to identify infection trends in a timely manner.
Why infection surveillance is challenging
For patients with blood cancers, infection is a constant concern due to a suppressed immune system. Stem-cell transplant recipients are particularly vulnerable, such as invasive fungal infections, which can be life-threatening. It is important to be vigilant and monitor infection trends to identify outbreaks early and recognise infection risk for new cancer therapies, to enable clinical teams to implement effective infection prevention strategies.
Unfortunately, it’s a difficult problem to tackle. Diagnostic coding is not always helpful and can be delayed. Many microbiology cultures come back negative even when infection is present. The European Organisation for Research and Treatment of Cancer (EORTC) consensus criteria that defines what is an invasive fungal infection rely on multiple data sources — microbiology, imaging, histopathology, and patient factors. However, these data sources are disparate and time-consuming to collect and analyse.
The hypothesis posed by the EINSTEIN team is that artificial intelligence (AI), applied carefully and with clinicians in the driver’s seat, could do most of that work automatically.
Machine learning driving algorithm improvements
EINSTEIN’S architecture is elegant in its simplicity. Currently, every fortnight structured and unstructured data is extracted from the hospitals’ EMR — demographics, microbiology, imaging, histopathology, prescribing. An Extract Transform Load (ETL) process moves these data into a database that has been designed on a common data model, so that data is consistent and ready to query.
Then the algorithms get to work. Rule-based classifiers handle the cases that follow clear logic. Machine-learning classifiers picks up the more nuanced patterns. Together they identify candidate infection episodes, flagging them and surfacing them to the right clinician through a purpose-built portal. An evaluation module feeds clinician confirmations and corrections back into the system, so the algorithms are able to continuously improve. Each iteration tightens the loop.
At present, EINSTEIN runs across two infection types: fungal (Invasive Fungal Infection Surveillance) and viral (Cytomegalovirus or CMV). The fungal module prototype already demonstrates what the platform is capable of, with a monitoring dashboard that tracks invasive fungal infection episodes across time, broken down by underlying cancer and cancer treatment.
The enabling factor: a data partnership that works
The key to the success of any AI enablement in health is the underlying data. Without a reliable, validated, well-modelled pipeline from the EMR to the algorithms, even the best machine-learning model may produce nothing more than a confident hallucination.
EINSTEIN’s partnership with BioGrid Australia is pivotal to its success. BioGrid handles the application and data infrastructure, the cyber-security liaison, the database design based on a common data model, the ETL process and the rule-based result classification.
BioGrid also looks after the requirements and testing documentation, validation of the hospital EMR data extraction, and the preparation of data for the clinician-facing dashboards. Weekly meetings between the BioGrid team and the NCIC clinical team mean issues are addressed as they emerge.
This foundational work is the reason the algorithms reach 93% sensitivity for invasive fungal infections, and the reason clinicians can trust what they are seeing on screen.
Demonstrating that AI can help clinicians save lives
EINSTEIN is a proof point for what becomes possible when clinical expertise, AI capability, and an experienced data partner work together.
The team’s high degree of confidence in the work is demonstrated by the release in July 2026 of the Invasive Fungal Infection Surveillance (IFIS) platform, designed in consultation with clinicians and tested by users. This launch represents an important step towards a learning health system, where AI-powered tools enhance surveillance, reduce administrative burden, and allow clinicians to focus more directly on patient care.
This is the result of years of hard work with several collaborators including RMIT University and the University of Melbourne, who developed the algorithms, the Guidance Group at the Royal Melbourne Hospital who developed the dashboard, and BioGrid.
Work originally commenced in 2020 with an NHMRC grant awarded to Prof Karin Thursky of the Peter MacCallum Cancer Centre for Invasive Fungal Infections (IFI) Surveillance project.
When the IFI project started, there wasn’t another platform in the world carrying out this type of work. IFIS was a pilot project targeted specifically towards invasive fungal infection as a pilot, demonstrating that the approach works and is scalable.
The work continued with the EINSTEIN project, supported by an MRFF grant in 2023 and led by Professor Leon Worth, extending the model to other types of infection, applying natural language processing to many different data sources including emergency presentations, pathology, and radiology to identify the conditions under which an infection might occur and which patients are experiencing those conditions.
This work was recently acknowledged when the EINSTEIN project was named a finalist in the Community Impact category of the Australian Financial Review AI Awards, in well-deserved recognition of the significant value of this program.
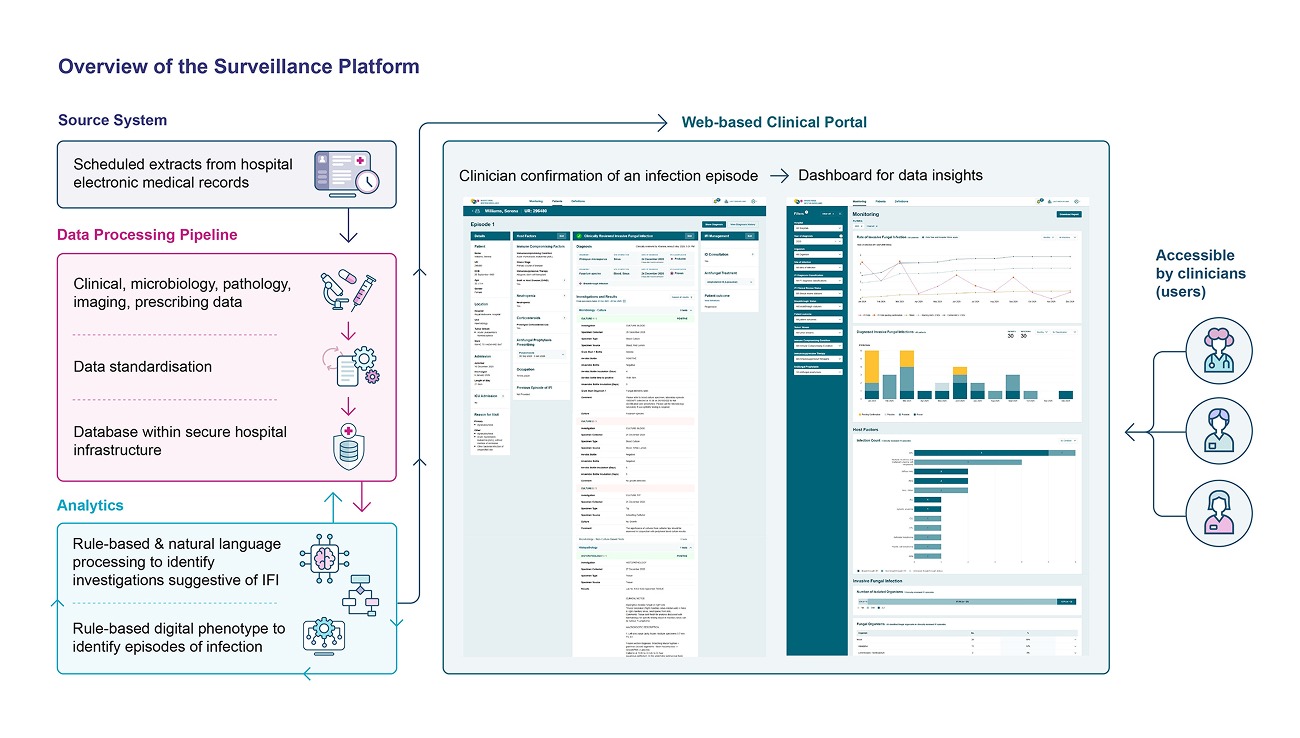
Illustration 1: the Invasive Fungal Infections Surveillance dashboard